

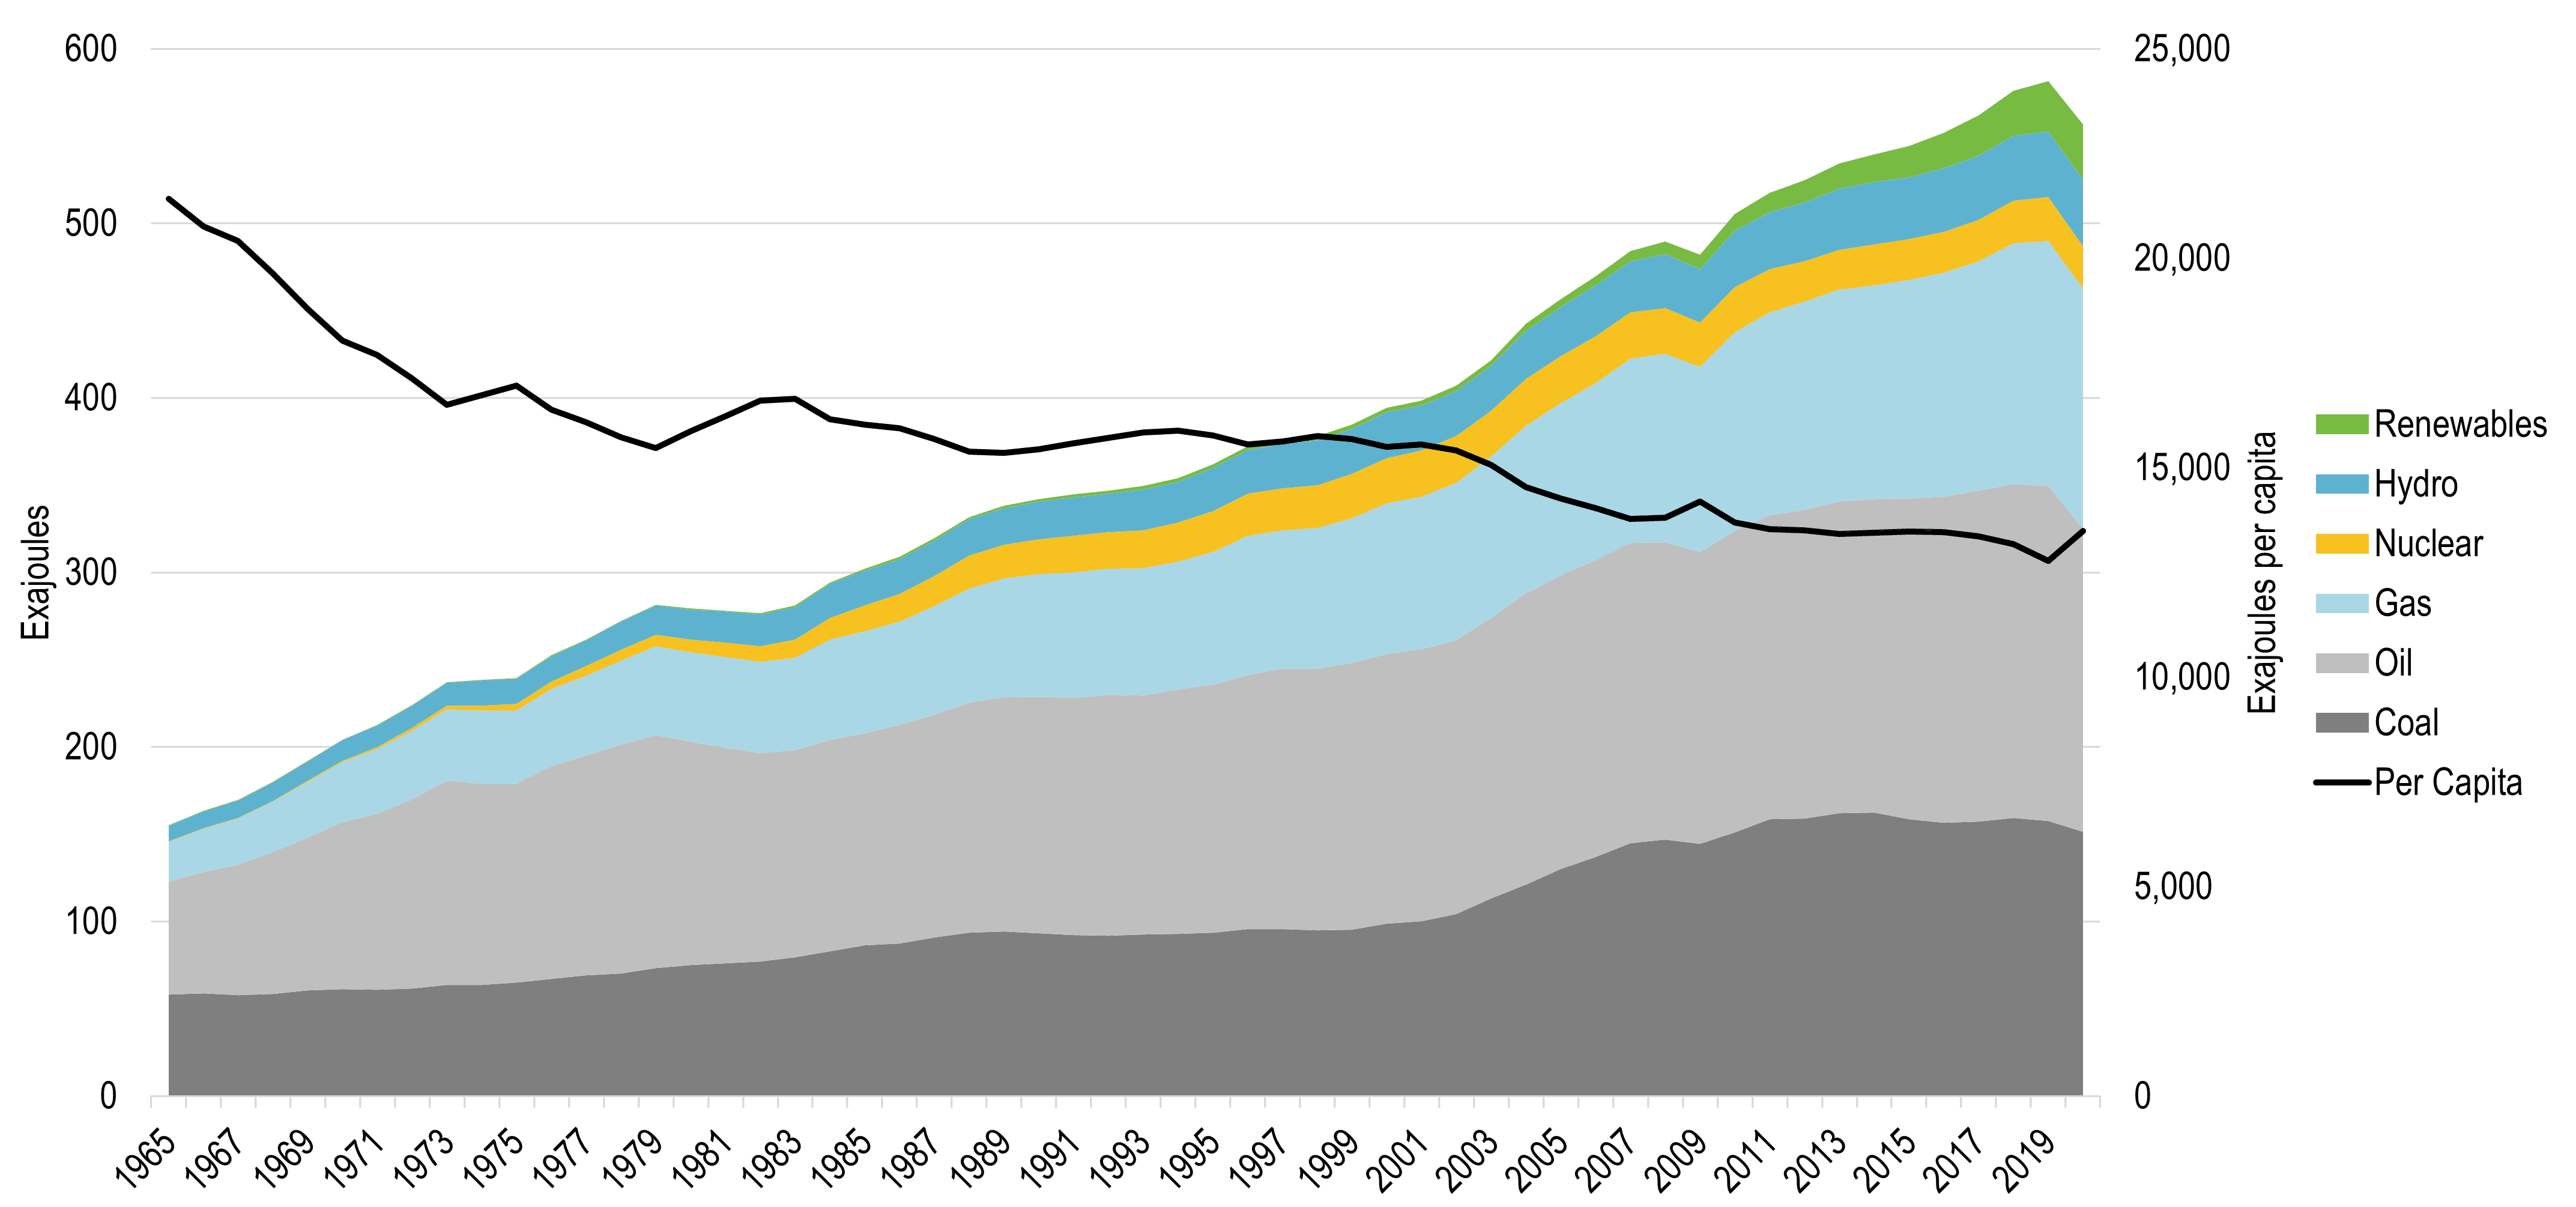
As you can see, we hit the top of that mountain in 2018, and now are skiing downhill on total energy consumption. What will be interesting to see now is how the slope on this graph changes. The second derivative, for you folks familiar with calculus. Unless I miss my guess, this is where the effects on money supply will become more pronounced and less amenable to manipulation, and the slope should take a marked negative increase over the next 5 years. It's running positive 2019-20, but probably not for long. This graph doesn't show past 2020, so gotta wait for an update.
So mark 2018 on your calendar as the Year the Universe Changed. Notably, this predates Covid. Ihat should make your conspiracy radar blink.
RE