


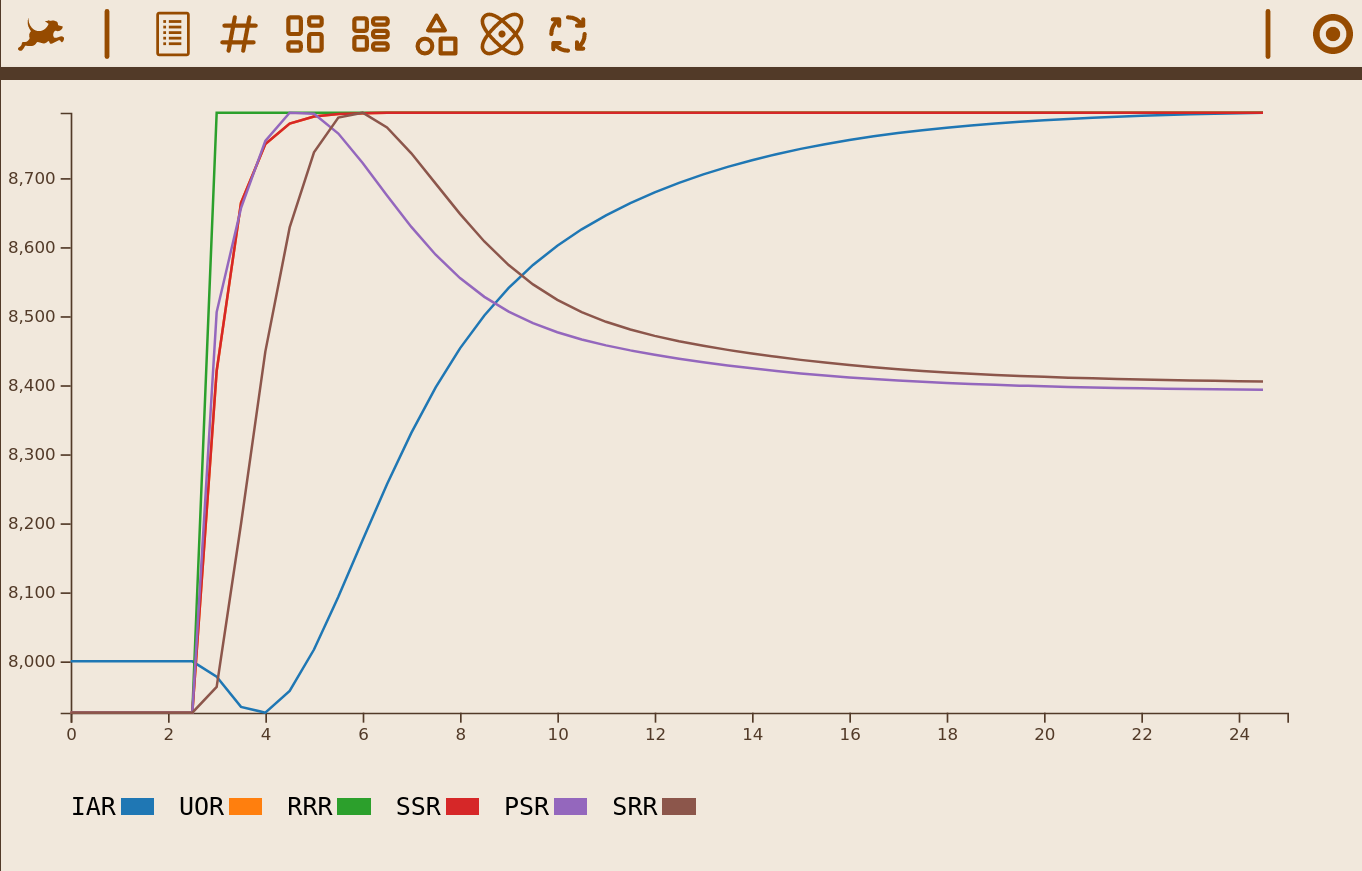
The scales on the graph are unfinished. The plots are not scaled to the vertical axis relative to each other as dictated by the plot card yet.
That is the next thing to get working. More fully parse the PLOT card. So far I have just grabbed the variable names and charged on to get this far. I also need to get the PRINT card printing. So far I only grabbed variable names from the PRINT card and collected the data for them as the model ran.
The icons on top are buttons that run tasks. The meanings change as I change my code. The rotating arrow button currently shows the results you see. I clicked it before taking the screenshot. In final form these buttons will be the user interface. Appearance and code will then match, but not now. Before I reconstruct the original Limits to Growth card deck.
So far I have about 90 functions in 1500 lines of JavaScript. Each of the buttons jumps to a function a generates a chain of activity that gets a task done when pressed.
The Dog button fetches a Dynamo Card Deck file. Each line represents a card. Clicking the buttons in sequence runs tasks that are done sequentially to process the deck so it can produce and show output.