


Processing the details of the plot card was a challenge. And the example plot in the users manual has two scales but the demo plot card did not specify the plot limits.
Example:
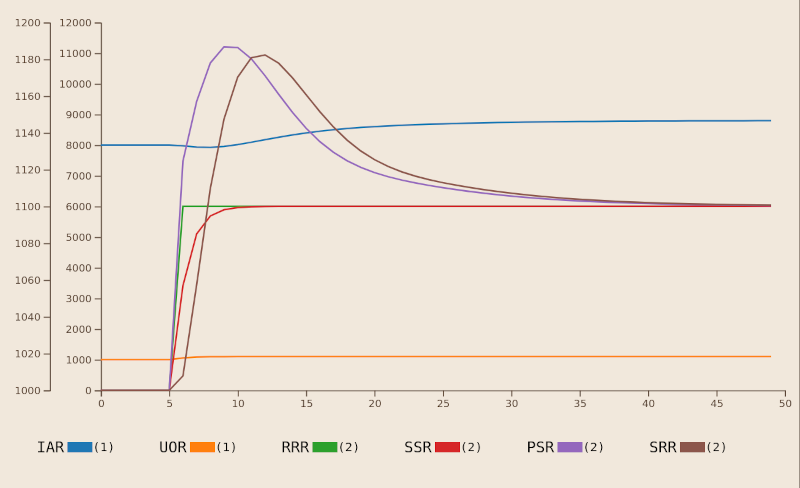
PLOT IAR=I,UOR=U/RRR=R,SSR=S,PSR=P,SRR=Q
Corrected:
PLOT IAR=I,UOR=U(0,12000)/RRR=R,SSR=S,PSR=P,SRR=Q(1000,1200)
UOR and SSR were cleverly picked to plot because they are on top of each other if both plot to a default scale. UOR is hidden in my first version which had only internally generated limits.
Scale limits are added to the two plot groups, each plot group has it's variables plotted to the same scale. The notation to specify the vertical scale limits follows the user manual notation. Defaults are generated if scale limits are omitted.
Leaving the scale limits off the original card made sense so as to not confuse the reader. Reading the plot card specification clears things up right away. Scale groups are separated by '/' on the plot card. Scale group numbers next to the variable swatch map tell what scale to use to read the variable.